
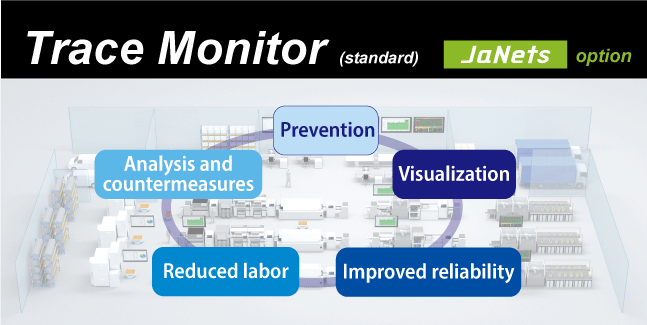
Catch and fix production abnormalities!
Achieve better results by visualizing production conditions
Catalog download ContactData collected during production at all times. Prevent from the problems getting seriously by early detection of line abnormalities
Before |
|
|---|---|
After |
|
Easy data collection and analysis. Countermeasures can be taken immediately after a problem
Before |
|
|---|---|
After |
|
Automatic data collection and easy to data processing
Before |
|
|---|---|
After |
|
Reliable data collected and saved automatically
Before |
|
|---|---|
After |
|
Timely visualization of production conditions. Easy information sharing
Before |
|
|---|---|
After |
|
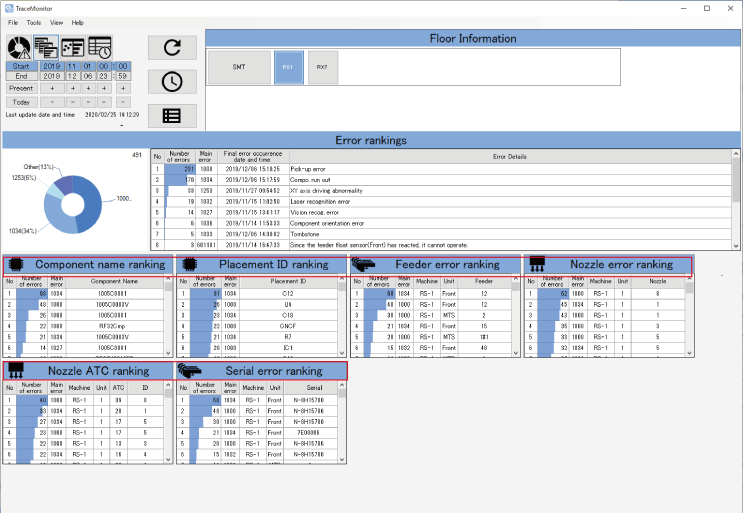
See the most frequent causes of errors for each component in a given time period. The most critical problems and improvements required are identified to improve performance.
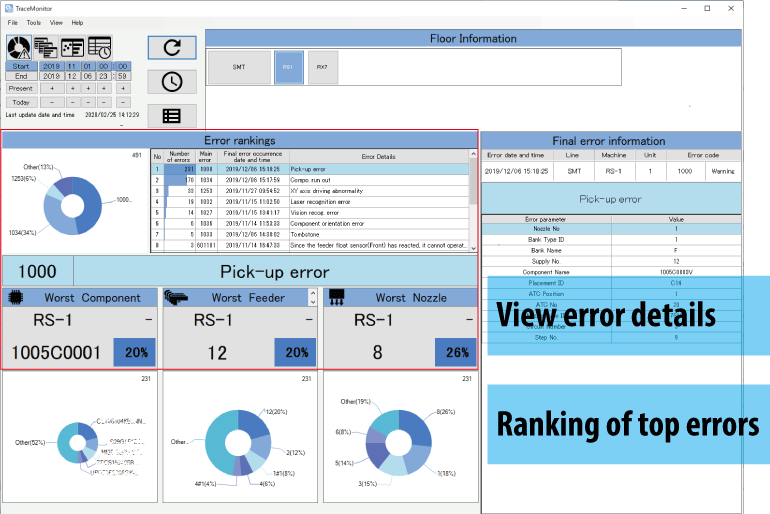
In addition to the items on the error ranking screen, the serial number, nozzle ID, Displays more detailed error details, such as serial number. By analyzing which combination has more errors, it is possible to better identify the root cause.
At a glance view of the changes that have occurred. Cycle time, boards completed, and errors are displayed in chronological order. By analyzing the event history and relationships, it is possible to identify when changes occurred.
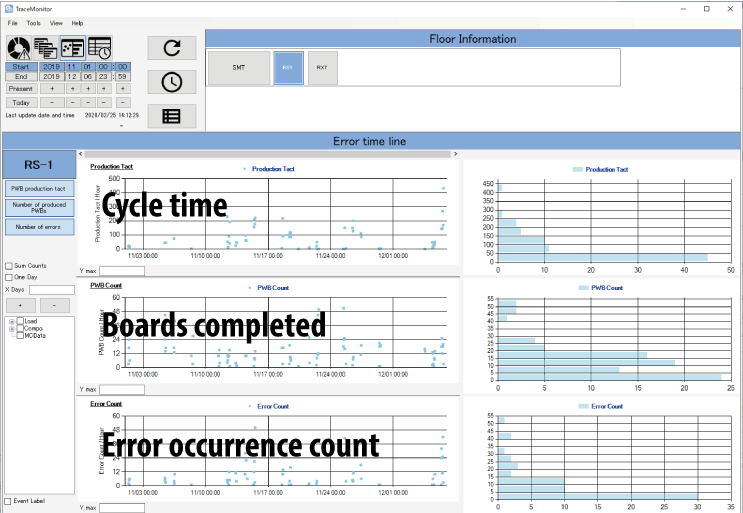
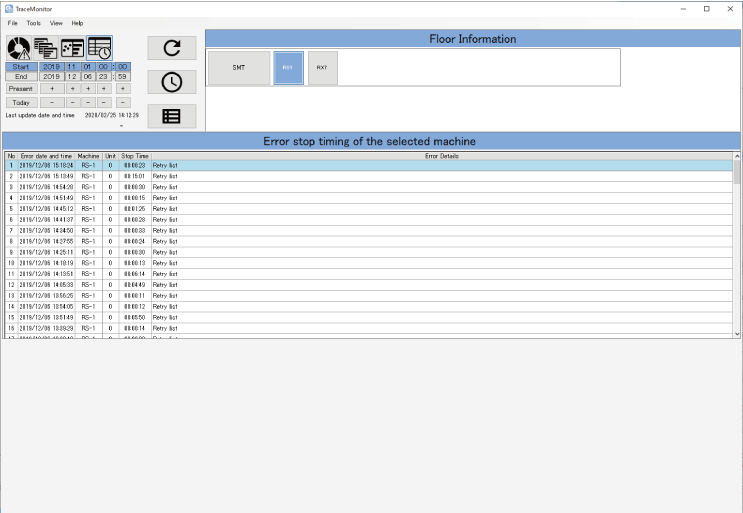
Details of errors and machine stops are displayed chronologically. By analyzing this history, improvements can be made to minimize the unplanned stop time and increase machine availability.
| Max. number of machines connected | 15 units (same as JaNets) |
|---|---|
| Analysis function | Tabulation, display, and search |
| PC used | Refer to JaNets specifications |
| Server | Unnecessary |
RS-1R / RS-1、RX-6 / RX-6R / RX-6B、RX-7 / RX-7R、JM-100
Contact